Linking the GPR to GPS
In this particular survey the GPR was triggered using an odomoter and a fixed trace spacing. This works well, but unfortunately it doesn’t give you geolocation. This is why GPR data are usually collected jointly with a GPS which would make this step unneccessary. Anyway, be it as it may, the problem is now as follows: We have a fixed number of traces which were collected with a fixed trace spacing (here 0.2 m). Start, intermediated and turning points were marked with a GPS (stored in a separate txt file ‘CoordsOldFan.txt’). The goal is now to linearly interpolate between these points so that we can assign a geolocation to each trace. The result should look as follows:
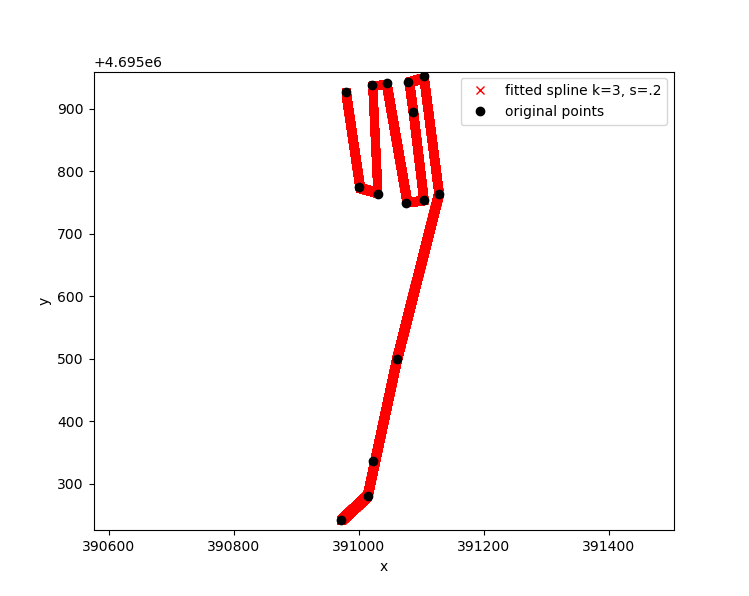
And those are the corresponding functions developed in class
def Coords2UTM(Lat, LatDM, Lon, LonDM):
    """
    Helper function: Move into a local rectangluar coordinate system
    """
    #input Lat LatDecimalminutes Lon LonDecimalMinutes
    #output Lat decimal degrees; Lon decimal degrees
    LatDD = Lat+LatDM/60.0
    LonDD = Lon+LonDM/60.0
    transformer = Transformer.from_crs("EPSG:4326", "EPSG:32633")
    x,y = transformer.transform(LatDD,LonDD)
    return x, y

def InterpolateCoordsToTrace(FilePath2Coordinates,LineID,NumberOfPoints,AuxPlot):
  """
  Interpolated coordinates linearly between ordered set of points
  """
  from scipy.interpolate import UnivariateSpline
  ## Adapted from Stackoverflow use spline interpolation btw. points
  ## Read Coords
  df = pd.read_csv(FilePath2Coordinates, sep=' ',comment='#')
  ## Get all coords pertaining to Line and get distance
  ldf = df[df['LineID'].str.match(LineID)].copy()
  xx,yy = Coords2UTM(ldf.iloc[:, 1], ldf.iloc[:, 2],ldf.iloc[:, 3], ldf.iloc[:, 4])


  ldf['x'] = xx;ldf['y'] = yy
  ldistance = np.cumsum( np.sqrt(np.diff(xx)**2 + np.diff(yy)**2 ) )
  ldistance = np.insert(ldistance, 0, 0)/ldistance[-1] ##Check RD

  # Build a list of the spline function, one for each dimension:
  points = np.vstack( (xx, yy) ).T
  # This is rubber banding
  #splines = [UnivariateSpline(ldistance, coords, k=3, s=.2) for coords in points.T]
  splines = [UnivariateSpline(ldistance, coords, k=1) for coords in points.T]
  # Computed the spline for the asked distances:
  alpha = np.linspace(0, 1, NumberOfPoints)
  points_fitted = np.vstack( spl(alpha) for spl in splines ).T

  if AuxPlot==1:
      # Graph:
      plt.plot(*points.T, 'ok', label='original points');
      plt.plot(*points_fitted.T, 'xr', label='fitted spline k=3, s=.2');
      plt.axis('equal'); plt.legend(); plt.xlabel('x'); plt.ylabel('y');
      plt.show()
  df_track = pd.DataFrame();df_track['x']=points_fitted[:,0];df_track['y']=points_fitted[:,1]
  return df_track


  def LinkGprWithDEM(PathToRaw,PathToProc,FilePath2Coordinates,FilePath2DEM,LineID,AuxPlot=0):
      """
      Interpolated GPR coordinates between turning points.
      Extract DEM elevation at interpolated coordinates
      """
      if os.path.isfile(PathToProc):
          print('The output GPR file already exists. I skip this for now.')
      else:
          import scipy.io
          ##Load the RAW GPR file
          ldat = scipy.io.loadmat(PathToRaw)
          ##Apply the rubber-band correction using spline interpolation
          df_track = InterpolateCoordsToTrace(FilePath2Coordinates,LineID,ldat['tnum'][0][0],0)
          ##Get the topography from the DEM along GPR tracks.
          df_track = pygmt.grdtrack(grid=FilePath2DEM,points=df_track,newcolname = "elevation")

          ##Write all information into the GPR file
          ldat['x_coord']=np.array(df_track['x']);ldat['y_coord']=np.array(df_track['y']);
          ldat['elev']=np.array(df_track['elevation']);
          ldistance = np.cumsum( np.sqrt(np.diff(ldat['x_coord'])**2 + np.diff(ldat['y_coord'])**2 ) )
          ldistance = np.insert(ldistance, 0, 0)/ldistance[-1]
          ldat['dist']=ldistance
          ##Output GPR file for further processing.
          scipy.io.savemat(PathToProc, ldat)
          print(f'Wrote output GPR file {PathToProc}')
          tmp = ldat['elev']
          print(f'Max. elevation is:  {tmp.max()}')
          if AuxPlot==1:
              plt.fig()
              plt.plot( ldat['dist'], ldat['elev'],'r.')