Setup the Python environment
Installation
You have to install Python and Spyder on your computer. The PCs in the lab 2U03 and the laptops in the seminar room 4F03 have it already installed.
Python is an open-source environment with significant input from the user community. Many of the developments are packaged in libraries designed for specific tasks. These need to be installed prior to usage which at times can be a bit tricky because of dependencies between different libraries. Ensure that you have the following Python packages:
Matplotlib
Numpy
Pandas
Editors: You can use any text editor to write your python code. However, editors which are designed specifically for coding in python offer you different featues, such as code completion, syntax highlighting and auto indentation, which will make your life much easier. Examples of such editors are PyCharm, Anaconda, IDLE, Jupyter, Spyder.
Indentations: While other programming languages are using brackets or other features to structure parts of the code in blocks, in Python this is done using indentations. This means that if you by accident add indentaions manually your code won’t run as expected.
Test program
To ensure that Python is installed correctly you can run this simple test program:
# This is a comment and will be ignored.
# Save this file as "test_python.py"

import matplotlib.pyplot as plt
import numpy as np

# Some data for plotting:
t = np.arange(0.0, 2.0, 0.01)
s = 1.0 + np . sin(2.0 * np.pi * t)

# Create the plots:
fig, ax = plt.subplots()
ax.plot(t, s)

ax.set(xlabel="time(s)", ylabel="voltage (mV)", title="About as simple as it gets, folks")
ax.grid()

# Show everything in the end:
plt.show()
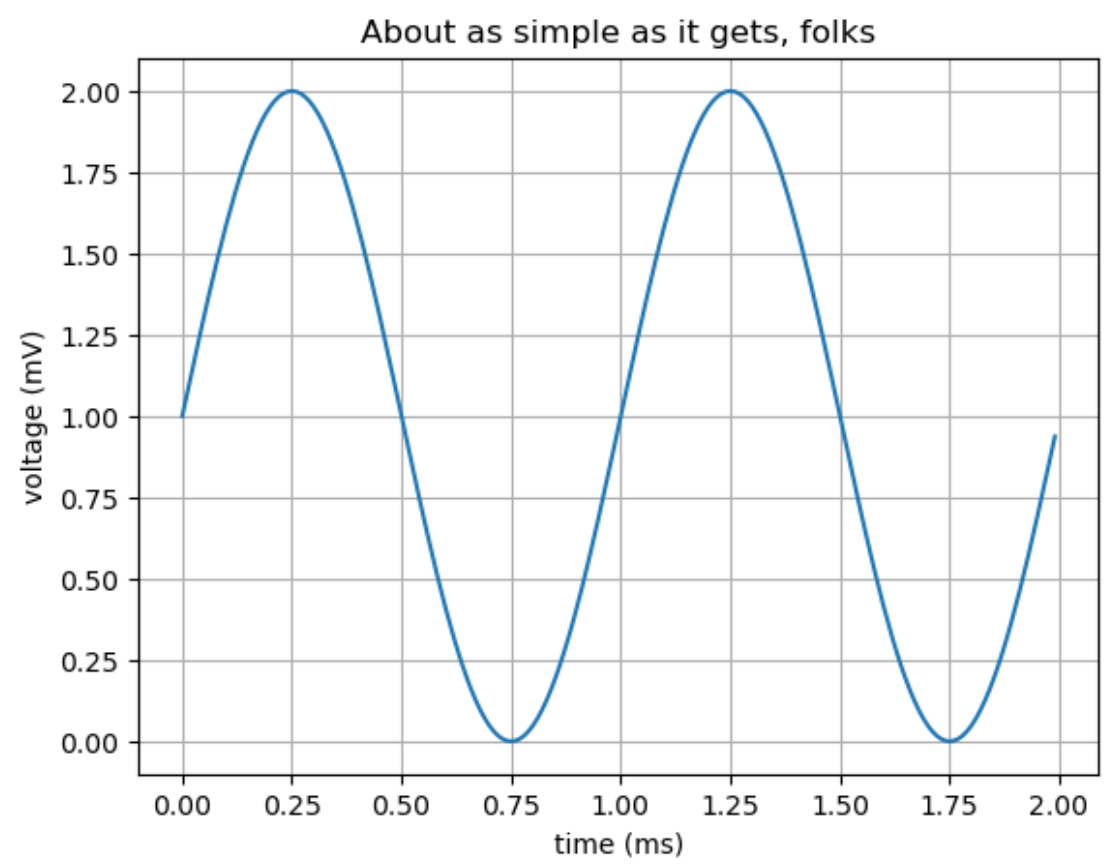
The result should look something like this: